

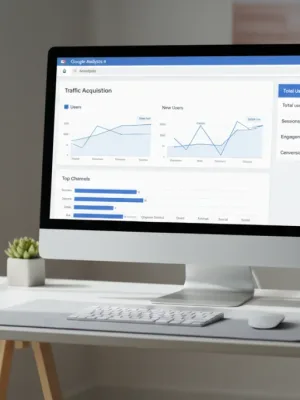
Opening Google Analytics 4 for the first time often feels disorienting. If you spent years relying on Universal Analytics, the sudden disappearance of familiar metrics like bounce rate and standard views can make standard reporting feel inaccessible. Instead of simple pageview tables, you encounter event streams, customizable cards, and complex exploration tabs.
Advertisements
You do not need to master advanced data modeling to track performance accurately. When you learn how to read Google Analytics 4 by focusing on a few core areas, the platform becomes significantly easier to manage. Filtering out unnecessary metrics lets you pinpoint where your visitors originate, which content holds their attention, and how effectively your website converts attention into action.
The Fundamental Shift: Events Instead of Sessions
To interpret your numbers correctly, you must understand how GA4 handles visitor activity. Older analytics systems grouped user actions into continuous sessions tied directly to pageviews. GA4 treats every user interaction as an independent event. A page load, a link click, a video play, and a file download are all logged as distinct events with their own parameters.
This event-based model offers greater flexibility, but it requires a change in perspective. Rather than asking how many pages a single visitor browsed in three minutes, you evaluate the specific actions they completed while navigating your site. Once you adjust to this structure, the data reveals a clearer picture of user behavior across modern, dynamic web pages.
The 4 Standard Reports You Actually Need
The standard GA4 sidebar includes dozens of prebuilt charts, but most site owners only need four standard screens for weekly performance tracking.
- Traffic Acquisition: Located under Reports > Acquisition. This shows which channels (organic search, email, paid ads, social media) send visitors to your domain.
- User Acquisition: Also under Acquisition. This identifies the original touchpoint that first introduced a visitor to your brand, which helps evaluate top-of-funnel campaigns.
- Pages and Screens: Located under Reports > Engagement. This lists your most popular URLs, average time spent on each page, and active user counts.
- Events: Located under Reports > Engagement. This tracks how frequently visitors trigger specific actions, such as form submissions, outbound clicks, or PDF downloads.
Decoding Traffic Acquisition: Sessions vs. First User
One common source of confusion in GA4 is the distinction between User Acquisition and Traffic Acquisition. While both reports look similar at first glance, they answer fundamentally different marketing questions.
The First user primary channel group tells you how an individual discovered your site on their initial visit. If someone first arrived via organic Google search in January, returned via a direct bookmark in February, and purchased after clicking an email newsletter in March, their entire lifetime value links back to Organic Search in the User Acquisition report.
The Session primary channel group evaluates individual visits independently. In the same scenario, the March visit is credited directly to Email. Use User Acquisition to determine where new audiences discover you, and use Traffic Acquisition to evaluate what drives immediate, day-to-day engagement.
| Report Metric Dimension | Primary Question Answered | Best Use Case |
|---|---|---|
| First User Channel | How did new people initially find my site? | Top-of-funnel marketing & brand awareness |
| Session Channel | What drove visits during this specific timeframe? | Promotional campaigns & weekly traffic spikes |
| Landing Page | Which specific URL brought users in first? | SEO performance & ad destination testing |
Understanding Engagement Rate and Conversions
In older platforms, bounce rate measured the percentage of single-page sessions where no further interaction occurred. GA4 replaces that metric with Engagement Rate. An engaged session is officially recorded when a visitor meets at least one of three criteria:
- They stay on the active page for at least 10 seconds.
- They view two or more separate pages.
- They trigger at least one conversion event.
Engagement rate represents the percentage of total sessions that met those standards. If your site records 1,000 sessions and 650 of them qualify as engaged, your engagement rate is 65%. For most informational blogs and commercial websites, an engagement rate between 55% and 75% indicates healthy user intent.
If you want to track sales, sign-ups, or demo requests, designate those actions as key events in your admin panel. Once configured, you can evaluate conversion rates directly across specific channels, landing pages, and device types without running complex external spreadsheets.
Customizing Your Workspace for Daily Clarity
You do not need to accept GA4's default report layout as permanent. If you regularly consult specific metrics, customize the interface so those figures appear immediately upon login.
Click the Library icon at the bottom left of your reports navigation menu. From there, you can edit existing collections, remove reports you never read (such as app-specific or gaming metrics), and pin essential landing page reports to your primary menu. Tailoring your workspace prevents information overload and keeps your team focused on metrics that inform day-to-day operational choices.
Building a Practical Routine to Read Google Analytics 4
Reviewing web analytics should clarify your operational strategy rather than consume hours of your week. Establish a routine where you check your Traffic Acquisition report every Monday to identify sudden drops or spikes in primary channels, followed by a monthly review of top landing pages and conversion actions.
When you focus on user intent, channel efficiency, and practical conversion paths, learning to read Google Analytics 4 transforms an intimidating platform into a reliable, straightforward asset for sustainable business growth.